
Listening to Restless Mountains: Inside Modern Volcanic Activity Monitoring
Far beneath snow‑capped summits and ocean waves, molten rock is constantly shifting, cracking surrounding rock and releasing invisible gases. Subtle ground swelling, faint tremors and changing fumes become clues that researchers piece together to understand unrest, refine risk maps and support timely, evidence‑based preparedness decisions.
This story is part of Esgamesol's practical reading library across everyday topics.
Many Signals, One Restless System
The different “voices” of a volcano
Before dramatic fountains of molten rock or choking ash clouds appear, subtler hints usually emerge. Deep movement of molten rock can fracture solid rock, warm groundwater, release chemical vapors and gently flex the surface. Each effect leaves a different kind of trace: shaking, heat, chemical changes, or slow shifts in shape. Instruments capture these traces, turning them into digital time series that can be compared and combined. No single sign, on its own, guarantees that an outburst is imminent. What matters is how the pieces line up: timing, strength, location and whether several shifts happen together rather than in isolation.
Learning each volcano’s “baseline”
Every volcanic system has its own temperament. Some rumble frequently and produce small outbursts with generous warning; others can sit quietly for decades and then change in a matter of days. Long‑term records create a baseline for each one: typical shaking levels, usual vapor output, common patterns of surface motion and temperature. When new data begins to drift away from that background picture, questions arise. Is molten rock intruding into shallow levels, or is groundwater simply rearranging? Careful comparison with past quiet periods and earlier episodes of unrest helps distinguish routine variability from genuinely unusual behavior that could precede dangerous activity.
Listening to Underground Vibrations
What subtle shaking reveals
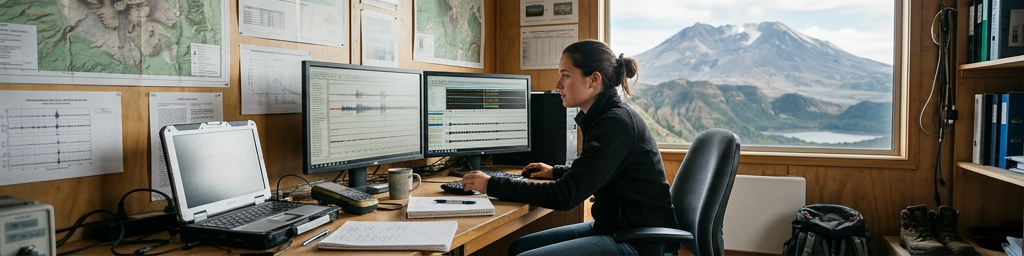
Sensitive ground sensors record vibrations far too small for people to feel. When molten rock forces its way through fractures, it generates short, sharp quakes that look spiky on seismograms. Fluids such as gas‑rich magma or hot water can produce longer, smoother pulses with a more musical quality. Continuous low‑frequency tremor may emerge as internal pathways resonate. By mapping when and where these different signals occur, specialists reconstruct pathways through the crust and identify zones where pressure appears to be building. A transition from deep, scattered events to clustered, shallow ones can be especially important for early warning.
Building 3‑D pictures from sensor networks
Ground sensors are rarely used alone. They are arranged in networks surrounding a volcano and sometimes extend far down its flanks. When a vibration reaches several stations, differences in arrival times show where inside the crust it started. Over days or weeks, many such locations outline rising columns or sideways intrusions of molten rock. During an active episode, real‑time displays show whether energy is migrating toward new vents or fading with time. This moving picture feeds directly into decisions about access restrictions, flight routes and temporary evacuations, especially when combined with other independent signs of increasing unrest.
| Monitoring method | Strengths for subsurface imaging | Typical limitations |
|---|---|---|
| Ground vibration networks | Track depth and pathways of moving magma in detail | Harder to interpret in very noisy or remote areas |
| Surface motion measurements | Reveal where pressure is inflating or deflating rock | May mix effects of fluids, landslides or groundwater |
| Gas plume tracking | Sensitive to changing magma depth and openness of conduits | Strongly influenced by weather and wind conditions |
Short explanations like this guide how different tools are weighted when interpreting new activity near populated regions.
Watching the Surface Flex and Warm
Tracking slow swelling and sinking
As molten rock gathers in underground pockets, the overlying ground can rise and stretch. When pressure drops or magma withdraws, that same ground may settle. Anchored positioning stations, similar to high‑precision navigation receivers, record these motions to within millimeters. Tiltmeters, embedded in rock, capture tiny changes in slope that would be invisible to the eye. When multiple stations around a summit all drift outward and upward in step, it often signals internal pressurization. In contrast, localized motion along one flank might point to landslides or slow slope failure rather than deeper magmatic change.
Wide‑angle views from above
Distant sensing techniques add a broad perspective. By repeatedly imaging the same area from above and comparing the patterns, surface uplift or subsidence can be mapped over many kilometers. Gentle bulges that would be impossible to spot while standing on the ground appear clearly once the images are combined. In some volcanic regions, long‑term series of such images have revealed repeated cycles of inflation and deflation without obvious surface outbursts, hinting at “breathing” magma bodies hidden deep below. These patterns feed into longer‑term assessments of which areas might host new vents in future episodes.
Heat as another surface clue
Where molten rock rises close to the surface, heat often follows. Cameras that detect infrared energy, handheld sensors and satellite instruments can all spot warming zones. Expanding hot areas near craters, newly formed warm springs or shifts in the temperature of existing features can accompany increased gas flow or shallow intrusions. However, surface warmth alone does not always point to magma. Heavy rain, changing groundwater routes, wildfires or even thick ash layers can modify apparent temperatures. Combining thermal information with ground motion and shaking data greatly improves confidence about what is really happening beneath the surface.
Breathing Gases and Moving Lava
Reading invisible vapors
Volcanoes constantly exhale mixtures of water vapor, carbon dioxide, sulfur compounds and trace elements. Different components escape at different depths and pressures, turning plume measurements into a kind of underground thermometer and pressure gauge. A steady background of vapor can signal open pathways that let gases leak out freely. Rising proportions of sulfur‑rich components, sustained over time, often suggest that fresher, hotter magma is approaching shallower levels. Fixed stations, mobile sensors and over‑flight instruments are used together to track both composition and total output, building time series that highlight slow trends rather than one‑off spikes.
Watching molten rock at the surface
When molten rock finally emerges, watching its movement becomes essential for hazard planning. Cameras, thermal instruments and ground teams track how fast flows advance, where they are heading and whether new breakouts are forming. These observations help update maps of threatened roads, homes and infrastructure. Even slow‑moving flows can cut off key routes or isolate communities. Comparing current flow paths with deposits from earlier activity refines expectations about which corridors may be used again, which in turn shapes evacuation plans and land‑use decisions in the long term.
| Hazard focus | Most informative observations | Common preparedness uses |
|---|---|---|
| Fast‑moving flows and surges | Real‑time cameras, vibration patterns, near‑vent deformation | Defining exclusion zones and rapid evacuation triggers |
| Lava advances | Thermal imaging, surface mapping, field checks | Protecting roads, utilities and key access corridors |
| Ash and gas clouds | Plume tracking, atmospheric sampling, remote imaging | Rerouting flights and issuing air quality guidance |
Such comparisons help emergency managers decide which information streams matter most for their specific local concerns.
People, Fieldwork and Alert Decisions
Why field visits still matter
Despite dense digital networks, on‑the‑ground work remains irreplaceable. Teams hike to remote stations to fix instruments, clear ash from solar panels and recalibrate sensors. They sample rocks, water and gases, photograph new cracks or small vents and test whether strange readings reflect real change or simple equipment problems. A sudden drop in recorded gas could mean calm conditions—or a blocked tube. Odd shaking patterns might come from a damaged sensor. Field checks convert abstract numbers into physical reality, reducing the risk of misinterpreting faulty data as genuine volcanic unrest.
Turning complex data into clear alerts
All streams of information—vibrations, surface motion, vapor measurements, heat maps and field reports—converge in monitoring centers. Specialists from different backgrounds compare notes, test alternative explanations and assess how closely current patterns resemble previous episodes. Activity scales or color codes, agreed with civil authorities in advance, translate this technical picture into simple levels of concern. Moving to a higher level rarely implies certainty that an outburst will occur; instead, it signals that the chance of disruptive behavior has risen enough to justify stronger precautions, such as tightening access rules or reviewing evacuation logistics.
Building trust and long‑term resilience
For people living or traveling near active peaks, the value of all this work depends on communication. Clear, calm explanations help communities understand that warnings are based on measured changes, not rumors or speculation. Outreach programs, school visits and public explanations of common signals—shaking patterns, vapor shifts, ground motion—make the science more familiar and less frightening. Over years, the same monitoring that supports daily safety decisions also feeds into research on past events, better hazard maps and more realistic planning. By listening carefully to restless mountains, societies gain time to act before quiet landscapes change suddenly.
Q&A
-
How does seismic signal analysis help distinguish between magma movement and regular tectonic earthquakes?
By comparing frequency content, waveform shape, and event clustering, scientists can separate long-period volcanic tremor from high-frequency tectonic quakes, revealing magma intrusion paths and improving eruption forecasting accuracy. -
What can lava flow observation tell us about future eruption behavior and hazards?
Tracking lava flow speed, thickness, cooling rate, and channel evolution helps estimate how future flows might travel, which communities are at risk, and where to prioritize barriers, diversion structures, or exclusion zones. -
Why is gas emission measurement crucial for eruption warning systems?
Changes in SO₂, CO₂, and H₂O fluxes often precede eruptions; rising gas output or shifts in CO₂/SO₂ ratios indicate magma ascent, allowing observatories to raise alert levels before visible surface activity begins. -
How do eruption warning systems integrate multiple data sources to reduce false alarms?
Modern systems fuse seismic, deformation, gas, thermal, and visual data in real time; statistical and machine-learning models weigh each signal’s reliability, lowering false alarms while still reacting quickly to genuine unrest. -
What unique insights does earth science fieldwork provide for geological hazard research that remote sensing alone cannot?
Fieldwork enables direct sampling of rock, ash, gas, and lava, ground-truthing satellite data, mapping small structures, and interviewing local communities, yielding a more accurate, context-rich understanding of hazard processes and impacts.