
Reading Rivers, Lakes, and Wetlands: What Long-Term Monitoring Reveals About Freshwater Life
Across temperate suburbs, farmed valleys, and protected forests, teams quietly return to the same stretches of water year after year. They record chemistry readings, map channel features, collect biological samples, and log subtle shifts that reveal how human pressures and climate are reshaping freshwater life.
This story is part of Esgamesol's practical reading library across everyday topics.
Why Watching Water Over Years Changes the Story
From snapshots to time‑lapse views
Standing beside a calm stream or lake, it is easy to believe things barely change. Yet beneath that surface, conditions can swing with storms, droughts, heatwaves, and shifting land use. A single visit is like a photograph: it may catch a dramatic weed outbreak or a fish kill, but it misses the slow drift in temperature, the gradual loss of sensitive species, or the creeping spread of nutrient‑loving algae. Repeated visits using the same methods turn those disconnected photos into a time‑lapse film. Patterns emerge: summers steadily warming, dry spells lasting longer, or recovery beginning after a pollution source is reduced. This long view helps avoid misreading a naturally variable stream as damaged, or assuming a quick flush of greenery equals full ecological recovery.
Three big questions behind long‑term watching
Most programmes circling back to the same rivers, lakes, and marshes are seeking answers to three linked questions. First, how is the water itself changing—with respect to temperature, clarity, dissolved substances, and flow? Second, how are the plants and animals that depend on that water responding over time? Third, how do those changes stack up across wider landscapes, rather than at one isolated site? Looking across these scales reveals whether a particular wetland is an outlier or part of a broader regional pattern. It also shows when pressures on land, such as intensive farming or urban growth, begin to echo downstream. This integrated approach has become central in English‑speaking regions where drinking water, cultural values, and recreation all rely on reliable, living freshwater systems.
Getting Close: Fieldwork on Banks, Boats, and Wetland Margins
What a routine visit actually involves
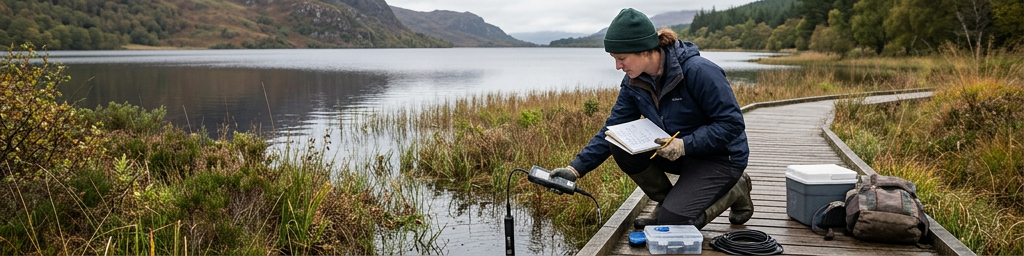
A typical monitoring day starts with planning: checking river levels, weather, access points, and safety gear. On arrival, teams pause to scan and listen before lifting a single tool. They note bank erosion, surface slicks, unusual smells, or dead organisms. Then the quiet routine begins: lowering multi‑parameter probes to record temperature, dissolved oxygen, acidity, and conductivity; filling bottles for laboratory tests of nutrients or trace contaminants; gauging flow or depth; and photographing landmarks for future comparison. Nets might collect invertebrates, and simple disks or optical sensors check how far light penetrates the water column. Every detail—recent storms, nearby earthworks, local reports of fish deaths—is written down. Consistency is crucial: the same spots, seasons, and methods are revisited for years so that genuine trends stand out from one‑off surprises.
Instruments that never leave the water
Complementing these human visits are instruments that stay in place through calm and storm. Buoys on lakes measure conditions from the surface down into deeper layers, logging every few minutes or hours. Riverbank stations record water level, temperature, and cloudiness day and night. In some cases, underwater loggers capture long strings of readings from different depths, revealing nightly oxygen dips linked to thick plant beds or repeated spikes in suspended sediment after rain. Over years, such continuous records show whether extreme events remain rare or are quietly becoming normal. A single oxygen crash is worrying; a pattern of frequent night‑time lows is a serious warning for fish and bottom‑dwelling animals.
| Aspect of field monitoring | Typical strengths | Typical limitations |
|---|---|---|
| Human visits to fixed sites | Rich visual context, flexible responses to unusual events, direct wildlife observations | Limited in time; can miss short‑lived peaks and crashes |
| Permanently installed sensors | Continuous records, excellent for detecting subtle long‑term shifts | Need maintenance; focus on physical and chemical signals, not full biodiversity |
Used together, regular human visits and tireless sensors turn scattered glimpses into a dense timeline of change.
Reading the Signals: Water, Wildlife, and Habitats
The liquid itself: chemistry, clarity, and flow
Core measurements—temperature, dissolved oxygen, nutrients, acidity, conductivity, and cloudiness—act as a common language for rivers, lakes, and marshes. Warmer water tends to hold less oxygen and favour different species. Rising nutrient levels push systems toward more frequent algal blooms, while increasing cloudiness can starve underwater plants of light. Flow and water‑level records show how long stretches remain wet, how often floodplains receive water, and whether low‑water periods are lengthening. In English‑speaking regions where demands for drinking water, hydropower, and irrigation are strong, these indicators highlight the trade‑offs between extraction and maintaining living habitats. Tracked over years, they reveal whether conditions are drifting toward clearer, cooler, better‑oxygenated states or sliding the other way.
Living indicators: insects, fish, plants, and algae
Plants and animals integrate what they experience over weeks and seasons, so their presence tells a deeper story than any single reading. Bottom‑living invertebrates respond to chronic sediment inputs, oxygen shortages, and habitat loss. Some species vanish quickly under persistent stress, while hardy generalists expand, simplifying the community. Fish communities reveal whether channels remain connected, whether spawning grounds are intact, and whether thermal niches are shrinking. Aquatic plants track light levels and nutrient supply, shifting from diverse meadows to dense mats of a few opportunists when conditions change. Rapidly responding algae can act as early warning beacons of enrichment. Returning to the same sites to count, identify, and sometimes weigh organisms shows who is thriving, who is fading, and how quickly communities are turning over.
Looking beyond headcounts: structure and function
A stream shaded by young saplings may look “green” yet still lack the fallen wood, deep pools, and undercut banks that support complex fish and invertebrate communities. Similarly, a freshly planted marsh may not yet slow floodwaters, store carbon, or host the variety of birds once present. Modern monitoring therefore looks hard at habitat features and ecosystem functions. Surveys map gravel bars, side channels, backwaters, reedbeds, and wet meadows; track whether fish can move freely between river and floodplain; and check if breeding attempts of frogs or wading birds are succeeding. Repeated assessments show whether restoration work is merely cosmetic or genuinely rebuilding the processes—natural filtering, nutrient cycling, flood buffering—that keep waters resilient.
From Local Streams to Wider Landscapes
Seeing from above: satellites and aerial images
Fieldwork offers intimate detail, but it cannot cover every pond, backwater, and marshy hollow. Repeated satellite images and aerial photographs fill that gap. Analysts trace shifting shorelines, merging or shrinking wetland patches, and the timing of seasonal flooding. Changes in surface greenness hint at vegetation health, while unusual discolouration over large areas can suggest widespread algal growth or sediment plumes. Long archives of images allow comparisons between current patterns and past decades, even where historical ground data are sparse. When these overhead views are combined with on‑the‑ground chemistry and wildlife records, they reveal not just that a wetland is shrinking, but also whether warming water, altered inflows, or land‑use changes around the catchment are likely drivers.
Making sense of drying streams and altered regimes
Not every trickle that disappears is in trouble. Many streams naturally switch between flowing, pooled, and dry states. Traditional health scores, built around always‑wet rivers, often misjudged these places as degraded simply because animals were absent when beds were dry. Long records of flow and water levels, matched with repeated biological surveys, allow a different view: sites are judged against other systems with similar natural rhythms. This avoids expensive efforts to keep naturally intermittent channels permanently full, while still flagging real declines where drying becomes more intense or prolonged than their historical norm. The same principle applies to lakes and marshes whose water levels swing seasonally: it is the pattern over many years, not a single low‑water snapshot, that matters.
| Flow pattern context | Ecological reading | Typical management focus |
|---|---|---|
| Naturally stable, always‑wet reaches | Sensitive to even small reductions in flow or oxygen | Safeguard baseflows; protect cool, shaded refuges |
| Naturally intermittent channels | Biota adapted to cycles of wetting and drying | Protect natural rhythm; avoid unnecessary flow‑stabilising works |
| Highly regulated systems | Flow patterns dominated by dams or withdrawals | Restore more natural variability where possible |
Interpreting change in context like this helps direct effort where it is most needed.
Why Long‑Term Freshwater Watching Matters for People
Guiding restoration, policy, and everyday choices
Records built over many seasons give communities and decision‑makers a reality check. They show whether riparian plantings are actually cooling streams, whether new farm practices are lowering nutrient peaks after storms, or whether restrictions on certain activities are improving conditions for sensitive wildlife. Where goals are not being met, long‑term data reveal whether the problem lies with insufficient effort, unexpected side‑effects, or broader pressures such as regional warming. For residents who swim, fish, or gather near these waters, this evidence translates into clearer explanations about local rules, development proposals, and restoration projects. Choices about land use, water extraction, and protection become easier to debate when everyone can see the same timelines of temperature, clarity, species, and habitat structure.
Building shared stewardship and future resilience
In many English‑speaking regions, people volunteer to lower simple measuring disks, map aquatic plants, or count frogs and birds. These contributions, when carefully trained and checked, extend the reach of formal monitoring programmes and root the work in local experience. Combined with professional surveys, sensor networks, and satellite records, they create layered stories of how individual creeks, reservoirs, and marshes are faring. As climate patterns shift and pressure on water grows, such long records become vital early‑warning systems. They highlight vulnerable places that may need extra protection, as well as success stories where investment genuinely boosts resilience. Above all, they turn distant “environmental trends” into something tangible: a familiar bend in a river that now warms earlier each spring, a favourite wetland track where certain birds no longer call, or a restored reach where clear flows and sensitive insects have returned. Long‑term watching keeps these changes visible—and offers the knowledge needed to keep freshwater life thriving in the years ahead.
Q&A
-
How do River Biodiversity Surveys help identify early signs of ecosystem degradation?
They reveal shifts in species composition, loss of sensitive taxa and dominance of tolerant species, which often occur before obvious water quality changes, providing an early-warning system for targeted management. -
Why is Lake Water Chemistry monitoring essential for managing harmful algal blooms?
Tracking nutrients, temperature, pH and dissolved oxygen helps predict bloom conditions, distinguish natural variability from pollution-driven change, and guide interventions like nutrient reduction or aeration. -
What key elements should be included in a robust Aquatic Habitat Assessment?
It should integrate channel morphology, flow regime, substrate type, riparian vegetation, connectivity, and human pressures to link physical habitat structure with species distribution and ecological processes. -
How does Wetland Conservation Science contribute to climate and flood resilience?
It quantifies wetlands’ carbon storage, floodwater retention and biodiversity benefits, guiding restoration designs, zoning decisions and incentive schemes that maximize ecosystem services and risk reduction. -
Which Water Quality Indicators are most informative in Ecological Field Research?
Dissolved oxygen, temperature, nutrients, conductivity, turbidity and biological indices from macroinvertebrates or periphyton jointly describe stressors, ecosystem functioning and long-term ecological trends.