
Reading Community Health in the Flow of Wastewater
Beneath streets and campuses, quiet underground networks carry more than rainwater and discarded household liquids. Within these mixed flows, tiny fragments of viral and bacterial material accumulate, forming a composite biological fingerprint of local residents. By measuring these signals over time, researchers can trace emerging infection patterns, compare locations, and spot unusual shifts in circulation long before hospital records fully reflect change.
This story is part of Esgamesol's practical reading library across everyday topics.
1. Why Sewage Carries A Collective Health Signal
Blended waste as an anonymous community sample
Every flush and drain adds a tiny contribution of biological and chemical material to shared pipes. Once these flows mix, they form a pooled sample from homes, workplaces, dorms, and public venues. Instead of asking individuals for swabs, blood draws, or surveys, researchers can tap into this blended stream and read signals from thousands of people at once. Because contributions are mixed beyond recognition, the focus shifts away from personal status toward broad patterns: whether certain infections are rising, how resistance markers are shifting, or whether particular exposures are becoming more common across an area.
What kinds of traces actually end up in pipes
Human waste routinely carries fragments of viral and bacterial genetic material, bits of cells, and residues from medicines, caffeine, nicotine, cleaning products, and other everyday substances. Many of these markers survive long enough in the sewer network to be detected with sensitive laboratory tools. Their concentrations are tiny, but modern techniques can pick up even low-level signals. When measured repeatedly over days or weeks, these traces offer a moving picture of how biological and chemical exposures in a catchment are changing, even if many people never visit a clinic or report test results.
Why this approach avoids individual tracking
Because samples are taken at large mixing points, there is no realistic way to link any signal back to a particular address. This built‑in anonymity is one of the reasons the method has gained traction in health agencies across English‑speaking regions. Data are interpreted in relative terms: higher or lower, rising or falling, stable or shifting. The goal is not to identify “who” but to understand “how much” and “in which direction,” so that services can prepare, inform, and support entire communities without targeting named people or streets.
2. From Murky Water To Measurable Signals
How sampling designs shape the story
Teams typically collect influent at treatment plants or major interceptors. “Grab” samples capture a single moment, while automatic samplers create flow‑weighted composites over many hours, smoothing peaks from breakfast, school runs, or stadium events. Sampling schedules—daily, several times a week, or weekly—set how fine‑grained the resulting health timelines can be. More frequent sampling reveals faster changes but requires more staff and lab capacity, so designs balance detail with cost and practicality.
Lab steps that turn noise into usable data
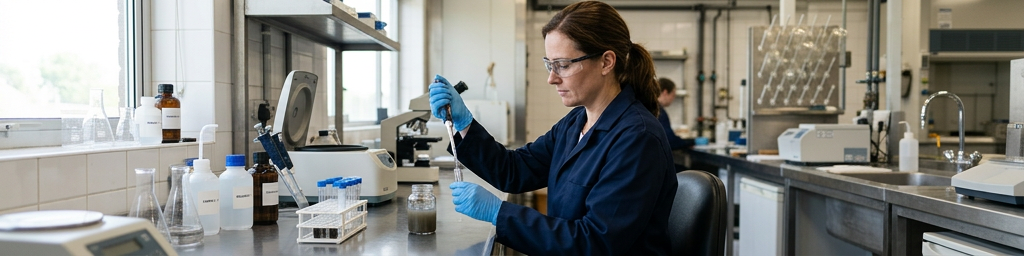
Once samples reach the lab, they are chilled, mixed, and often clarified to remove solids. To capture microbial signals, scientists concentrate the liquid and extract genetic material using standardized kits. For chemical markers, they use extraction and highly sensitive instruments to separate and detect target compounds. These workflows include controls to check that extraction worked, that instruments are calibrated, and that inhibition from detergents or other substances is not blocking detection. Without these safeguards, apparent drops or spikes could simply be lab artifacts.
Making sense of numbers with normalization
Raw readouts—like gene copies per millilitre—are not very interpretable on their own. Analysts therefore normalize values by flow volume, population estimates, or human‑associated reference markers that indicate how much human waste is present. This helps correct for effects such as heavy rain or changes in water use. Many dashboards in North America, Europe, and Australasia present the resulting signals as relative trends, banded levels (low, medium, high), or smoothed averages, which are easier for both officials and residents to interpret.
| Design choice | Typical options | Trade‑offs for health tracking (conceptual) |
|---|---|---|
| Sampling frequency | Daily / several times weekly / weekly | Higher frequency shows changes sooner but needs more resources |
| Sample type | Grab / time‑composite / flow‑composite | Flow‑composites reduce short spikes, improve stability |
| Normalization approach | Flow‑based / population‑based / markers | Different methods highlight different aspects of the signal |
| Target panel in the lab | Single organism / multi‑pathogen panel | Broader panels give richer insight but add complexity |
Why combining lab and system data matters
Even the best molecular techniques cannot be interpreted without context from the sewer system itself. Flow meters, pump logs, and rainfall records explain whether a sudden dip in a viral marker likely reflects a real decline or simply dilution. Information about industrial inputs or major building connections helps interpret odd patterns, such as signals that surge on weekdays but fade at weekends. In many English‑speaking cities, close collaboration between utility engineers and public health scientists has become essential for making robust sense of these measurements.
3. What These Underground Signals Can Reveal
Early hints of infectious disease waves
For many respiratory and gastrointestinal pathogens, the total amount of genetic material in sewage tends to track how widely they are circulating. In some regions, rises in these signals have preceded jumps in clinic visits or hospital admissions by days to weeks, giving health services extra time to prepare. Because the method does not depend on people seeking tests, it remains informative even when home testing is common or when access to healthcare varies between neighborhoods, rural towns, and remote communities.
Clues about medicine use and resistance pressures
Traces of antibiotics, antivirals, pain medications, and other drugs often appear in wastewater. While exact doses or who took them cannot be inferred, broad shifts help signal changing treatment patterns. Alongside these chemical residues, genetic markers linked with antimicrobial resistance show how resistance potential is distributed in the wider community, not only in hospitals. If certain resistance genes grow more common in the wastewater of a metropolitan area, it may point to mounting selective pressure that deserves closer investigation in clinics and farms.
Signals of daily habits and urban lifestyles
Markers from soaps, disinfectants, personal care products, nicotine, alcohol metabolites, and recreational substances all contribute tiny but detectable traces. Changes over seasons, during festivals, or after policy shifts can sometimes be seen in these patterns. Used carefully and ethically, such information can guide where to focus education, harm reduction, or mental health support—always at the level of groups or regions rather than individuals, and never as a sole basis for enforcement.
| Type of marker | Potential insight (broad, non‑individual) | Typical use context |
|---|---|---|
| Viral genetic fragments | Direction and relative intensity of infection waves | Planning for respiratory or enteric disease surges |
| Resistance genes | Shifts in community‑level resistance pressures | Informing stewardship and environmental safeguards |
| Drug residues | Long‑term changes in use of certain therapeutic or illicit substances | Supporting harm reduction and service allocation |
| Household chemicals | Patterns in hygiene and cleaning practices | Environmental and infrastructure management |
Reading patterns without over‑promising precision
Even with rich panels, wastewater rarely supports exact counts of infected people or precise prevalence of behaviors. Shedding rates differ by age, health status, and stage of infection; pipes vary in length and temperature; not everyone is on a sewered system. For that reason, public health groups in countries like the UK, Canada, Australia, and the US tend to use ranges, relative indices, and trend arrows rather than absolute “case numbers.” The strength lies in direction and timing, not in pinpoint accuracy.
4. Using Trends For Decisions While Protecting Communities
How agencies blend multiple data streams
Health departments usually interpret underground signals alongside clinical testing, hospital data, outbreak investigations, and local knowledge from general practitioners, schools, and community organizations. When several indicators move together—such as rising wastewater signals plus more emergency visits—confidence grows that action is warranted. When they diverge, teams look for explanations: perhaps testing rates dropped, a new home‑testing habit emerged, or intense rainfall diluted readings.
Communicating uncertainty in clear language
To avoid confusion or alarm, many public dashboards in English‑speaking regions use simple graphics and plain descriptions like “increasing,” “stable,” or “decreasing.” Technical details about assay limits or normalization methods are usually made available for interested readers, but everyday summaries focus on what the trends likely mean for preparedness and risk. Being upfront about uncertainty—explaining that signals are approximate and influenced by weather, infrastructure, and behavior—helps maintain public trust.
Privacy, fairness, and appropriate scale
Ethical guidance generally emphasizes sampling catchments large enough to avoid singling out small groups. Monitoring at huge plants that cover entire cities is least sensitive; sampling within single buildings or blocks is far more controversial. Discussions in anglophone settings highlight the risk of stigmatizing specific communities if data are misused. Clear policies about data governance, publication, and prohibition of enforcement uses are increasingly seen as essential safeguards.
Building partnerships beyond the lab
Successful programmes rely not only on scientists but also on wastewater utilities, local councils, Indigenous and community leaders, and social service providers. Engineers ensure samples represent the right catchments, while local organizations help interpret what signals might mean in practice—whether a rise in certain markers reflects crowded housing, seasonal migrant work, university terms, or other context‑specific factors. These partnerships turn raw numbers into locally relevant insight rather than generic charts.
5. Where This Quiet Science May Be Heading
Beyond single pathogens toward broader health panels
Future systems are likely to track multiple viruses, bacteria, parasites, and resistance genes at once, combining them into dashboards that show overall respiratory burden, gut infections, and environmental stressors. Some projects already layer chemical indicators—like markers of chronic disease treatment or exposure to certain pollutants—onto the same maps used for infection trends. The aim is not to create a constant “score” for neighborhoods, but to notice slow shifts that could otherwise stay invisible for years.
Integrating with urban and environmental planning
Because wastewater also reflects stormwater, industrial discharges, and infrastructure strain, its analysis can inform decisions about drainage upgrades, green spaces, and pollution control. Repeated spikes in certain markers near overloaded systems might suggest where investment in pipes, wetlands, or treatment capacity would improve both environmental quality and health resilience. In coastal and riverine cities across English‑speaking regions, these connections between pipes, ecosystems, and people are becoming harder to ignore.
Keeping equity and consent at the center
As methods become cheaper and more sensitive, the temptation to watch more places more closely will grow. The way this expansion happens will shape public acceptance for years. Transparent communication, community input into priorities, and explicit limits on use can ensure that wastewater‑based insights support care, not control. Framed well, this quiet science offers a rare combination: wide coverage without individual intrusion, early warning without constant personal monitoring, and a shared, anonymized view of how health flows through the places people call home.
Q&A
-
How does public health data tracking differ from traditional clinical record keeping?
Public health data tracking aggregates anonymized information from multiple sources—clinics, labs, environment, mobility, and demographics—to detect patterns and risks at the population level, rather than focusing on individual patient histories and billing records. -
What role does community disease monitoring play in early outbreak detection?
Community disease monitoring uses signals like syndromic reports, pharmacy sales, school absenteeism, and wastewater data to flag unusual spikes before hospitalizations rise, enabling earlier interventions and more targeted public health messaging. -
Why are environmental sampling methods crucial for urban health research?
Environmental sampling of air, water, surfaces, and wastewater reveals hidden circulation of pathogens and pollutants, helps map exposure hotspots, and links neighborhood-level environmental risks to observed health outcomes in city residents. -
How are population-level trends extracted from complex health datasets?
Analysts apply time-series analysis, geospatial mapping, and machine learning to large linked datasets, filtering noise, adjusting for confounders, and visualizing differences by place, age, or socioeconomic status to guide policy and resource allocation. -
What advances in laboratory detection techniques are transforming community disease surveillance?
High-throughput PCR, metagenomic sequencing, multiplex panels, and rapid point-of-care assays now detect multiple pathogens from a single sample, improve sensitivity for low-level circulation, and shorten turnaround, feeding richer data into urban health research.