
Frozen Time Capsules: What Antarctic Ice Cores Reveal About Earth’s Ancient Air and Climate
Deep beneath Antarctica’s surface, cylinders of compacted snow quietly preserve snapshots of Earth’s distant past. Layer by layer, they hold traces of old gases, volcanic ash, and shifting temperatures, allowing scientists to compare ancient conditions with today’s warming world and refine expectations for our planet’s future.
This story is part of Esgamesol's practical reading library across everyday topics.
From Falling Snow to Buried Archive
How Loose Snow Turns into a Climate Record
On the high polar plateau, each snowfall becomes another thin sheet in a growing stack. Because temperatures stay far below freezing, snow does not melt and refreeze each year. Instead, fresh flakes slowly bury older ones, squeezing them under their weight. Over time, the fluffy structure collapses into firn, a grainy, compact layer still riddled with tiny open channels.
Air from the overlying atmosphere fills those channels and can still move slowly up and down. With further burial, pressure forces grains to weld into solid ice, pinching off the passages. At that moment, countless air pockets become sealed bubbles. The ice around them remembers when the snow originally fell, while the imprisoned gas reflects conditions slightly later, when the pores finally closed. That offset in age matters when researchers compare temperature signals in the ice with gas measurements in the bubbles.
What Each Layer Quietly Preserves
Every annual layer carries more than frozen water. Isotopes in the ice reflect temperature at the time of snowfall. Dust hints at distant dry lands and strong winds. Sea salt grains signal storminess and sea-ice conditions. Volcanic ash layers mark explosive eruptions that briefly darkened skies. Near the surface, individual years can sometimes be counted like tree rings; deeper down, layers thin and stretch but still maintain order.
This vertical sequence behaves like a long, narrow bookshelf of climate chapters. Shifts in dust, chemistry, and isotopes reveal broad swings between colder, dustier times and milder, cleaner-air intervals. Combined with the trapped bubbles, the ice turns an apparently empty white landscape into one of the richest natural archives of environmental change on Earth.
Tools and Tactics for Sampling Deep Ice
Setting Up and Running a Drilling Site
Accessing the oldest portions of the archive means drilling through hundreds or thousands of meters of ice in remote, hostile conditions. Research teams first scout promising locations using radar and surface surveys to find thick, slowly flowing ice where layers are least disturbed. They then construct a compact camp with a drilling tower, power systems, shelters, and snow-protected storage for fresh cores.
A long, hollow drill is lowered down a narrow borehole. As it rotates, its cutters shave a ring of ice, allowing a clean cylinder to slide into the core barrel. Once full, the drill is winched back up. Technicians slide out the core section, log its depth, inspect visible features, and pack it into insulated boxes. The drill then returns downhole to repeat the process, building a continuous sequence from surface snow to ancient ice resting above bedrock.
Keeping Cores Cold, Clean, and Meaningful
Preserving the scientific value of each core section is as demanding as drilling it. Any warming, cracking, or contamination can blur the signals stored in the bubbles and crystals. Field teams handle cores with gloves, protect them from windblown exhaust, and keep them in cold trenches or portable freezers. During transport to distant laboratories, cores ride in refrigerated containers and are monitored closely.
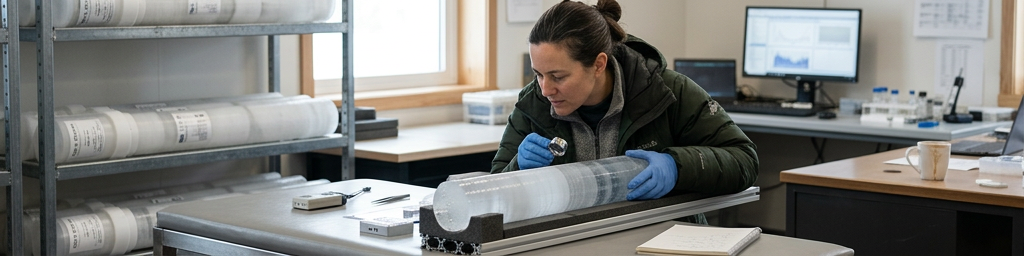
In cold rooms, technicians cut the long cylinders into segments dedicated to specific tests: gases, isotopes, dust, or chemistry. Each slice is measured, photographed, and traced back to its original depth. Because sampling often melts or crushes the ice, that portion can be used only once. Careful planning ensures no important interval is lost and that overlapping projects share material efficiently.
Choosing Sites for Different Scientific Questions
Not all drilling sites serve the same purpose. Locations with slow snowfall compress many years into a thin slice, extending the timeline far into the past but blurring seasonal detail. Places with faster accumulation preserve clearer year‑by‑year changes but reach back a shorter distance in time. Researchers also consider ice flow, avoiding margins where layers may fold and mix.
A simplified comparison looks like this:
| Site Type | Main Advantage | Typical Use Case |
|---|---|---|
| High plateau, slow snowfall | Long timeline, very old ice accessible | Multi‑cycle climate history, long‑term sensitivity |
| Moderate snowfall regions | Balance of age and detail | Regional variability, decadal to centennial changes |
| Coastal, faster snowfall zones | High‑resolution annual to seasonal record | Short, detailed reconstruction of recent centuries |
Choosing a mix of sites allows scientists to link fine‑scale regional stories with broad, long‑term global patterns.
Inside the Bubbles: Ancient Air and Ice Chemistry
Direct Samples of Past Greenhouse Gases
When a core section reaches the gas laboratory, a small piece is placed in a sealed chamber and gently crushed or melted under vacuum. As the bubbles burst, their imprisoned air flows into instruments that measure key gases at extremely low concentrations. The star players are carbon‑based and hydrogen‑rich compounds that strongly influence how much heat the atmosphere can trap.
Across repeated warm–cold cycles, these gases rise and fall within a relatively narrow band, closely tracking major climate swings. Warmer intervals show higher values; colder phases show lower ones. By following these curves through hundreds of thousands to millions of years, researchers see how modest shifts in atmospheric composition have repeatedly gone hand in hand with significant changes in ice volume, temperature, and sea level.
Isotopes in Ice as Thermometers and Tracers
The ice crystals themselves carry a second, independent set of clues. Water molecules come in slightly different weight versions, depending on how many heavy isotopes of oxygen or hydrogen they contain. Evaporation and condensation sort these forms in ways that depend on temperature and atmospheric circulation. Colder snowfall generally produces lower ratios of heavy isotopes in the final ice.
By measuring these ratios layer by layer, researchers reconstruct relative temperature changes through time. Where shallow cores overlap with modern weather records, relationships between isotope values and actual temperatures can be calibrated. That calibration is then extended down into older parts of deep cores, turning patterns of isotopes into long histories of surface conditions and ice‑sheet behavior.
Dust, Salt, and Volcanic Fingerprints
Beyond gases and isotopes, particles sprinkled through the ice enrich the climate story. High dust content often signals cold, dry continents with sparse vegetation and strong winds, conditions that produce more airborne mineral grains. Elevated sea salt implies more open water or stronger storms over nearby oceans and sea ice. Sudden spikes of volcanic ash and sulfate mark explosive eruptions that temporarily alter sunlight and atmospheric chemistry.
Together, these markers allow researchers to align ice‑core records with marine sediments, lake deposits, and other archives. If a dust pulse or volcanic layer appears in both polar ice and distant sediments, the two records can be synchronized, tightening age estimates and revealing how different parts of the planet responded to the same event.
Long Climate Rhythms and Today’s Break from the Pattern
Repeating Natural Cycles in the Deep Record
When the signals from gases, isotopes, and particles are plotted against depth, a pattern of repeated cold and warm phases emerges. Cold intervals are marked by lower greenhouse‑gas levels, heavier dust loading, and isotope values indicating lower temperatures and expanded ice sheets. Warm phases reverse those traits: higher gases, cleaner air, and isotopes pointing to retreating ice and milder conditions.
These swings do not occur randomly. They are paced by slow variations in Earth’s orbit that redistribute sunlight between seasons and latitudes. Orbital changes provide the initial nudge, but feedbacks involving ice reflectivity, greenhouse‑gas release from oceans and soils, and shifting circulation patterns amplify the shifts. Ice cores knit this chain together in a single, continuous archive that shows both drivers and responses.
Why the Most Recent Layers Stand Out
Near the top of many Antarctic cores, the curves take an unusual turn. Greenhouse‑gas concentrations climb sharply beyond the upper range seen in older warm phases. The rate of increase is faster than most transitions captured deeper in the ice, and the current values exceed those associated with past climates that already hosted smaller ice sheets and higher seas.
This abrupt deviation gives context to modern warming. In previous natural cycles, ice volume, temperature, and atmospheric composition changed together over thousands of years. Today, gases are rising within centuries, while ice and oceans are still catching up. That imbalance suggests that many impacts, such as long‑term sea‑level rise, have only partially responded so far to the new atmospheric state.
Comparing “Old Normal” and “New Trajectory”
To interpret what this means for the future, researchers often frame the contrast like this:
| Aspect | Long Natural Range (Ice‑Core View) | Recent Trajectory (Instrument & Core Overlap) |
|---|---|---|
| Greenhouse‑gas levels | Confined within modest upper and lower bands | Rapid rise beyond upper band in a short time span |
| Temperature response | Gradual, paced by orbital and feedback cycles | Faster increase, especially in polar and high‑latitude areas |
| Ice‑sheet behavior | Slow growth and retreat over millennia | Early signs of thinning and acceleration in some regions |
This comparison does not rely on a single model or dataset. It emerges directly from the layered ice and from modern observations that now overlap the youngest sections of the cores.
Q&A
-
How does paleoclimate evidence from ice cores differ from that from marine sediments?
Ice cores provide high‑resolution, annually layered records of atmospheric composition, while marine sediments offer longer but lower‑resolution histories of ocean conditions; combining them yields a more complete picture of Earth’s climate system. -
What makes atmospheric history records from ancient air bubbles so reliable?
Ancient air bubbles are actual samples of past atmosphere, sealed and undisturbed; with precise dating of surrounding ice and careful contamination control, they offer direct, quantitative greenhouse gas and aerosol records. -
Which polar research methods are most effective for long‑term climate reconstruction?
Deep ice coring, radar mapping of internal layers, and geophysical surveys, combined with isotopic and gas analyses, allow reconstruction of temperature, precipitation, and circulation over hundreds of thousands of years. -
How does ancient air bubble analysis support cryosphere studies today?
By linking gas concentrations to past ice-sheet thickness, melt events, and sea-level changes, bubble analysis helps calibrate models predicting how modern ice sheets will respond to current and future warming. -
Why are long-term climate reconstructions crucial for understanding tipping points in the cryosphere?
They reveal thresholds where small forcing triggered rapid ice loss or circulation shifts in the past, helping identify vulnerability ranges for Greenland, Antarctica, and sea ice under present greenhouse gas trajectories.